ScribeCount is pleased to announce the addition of Automated Analytics to the dashboard. Phase One includes Sell-Through, Read-Through, and Return-on-Investment related to Books, Series or Marketing.
ScribeCount started out as an easy way for authors to collect their sales reports from multiple platforms. The more platforms we added, the more requests we got to expand into other areas. This led us to include Ad Tracking, which led to Email data, which led to Direct Sales numbers, and with all that data combined the natural progression turned to making sense of it all.
This is where ScribeCount Analytics was born.
As Indie Authors we have lots of questions; about our books, about our marketing, and about our readers. Here are just a few we can answer with these Analytics reports:
- Am I getting the most I can out of this ad platform?
- How did this ad perform compared to the last time I ran it?
- Am I doing better with series A, or should I focus on writing more books for series B?
- What marketing service gives me the best return on my investment?
- Is this the best time of year to launch this book?
- What was the ROI for that last Free-First-in-Series ad that I ran?
- What’s the read-through rate for my new series in KU?
- At what book in my series do I lose the most readers?
- How is this launch strategy working when compared to my last one?
- If I don’t get a BookBub for this book, what’s my second-best ad platform?
Answering all of those questions requires A) a ton of data, B) a ton of math, and C) some excel skills.
You all like part A, you tell us so every day.
Part B and C…not so much.
To counter that math and excel stuff we have reduced report generation to a few easy clicks. Then, once the report has been generated, we walk you through the results using simple definitions and industry standard parameters. You don’t necessarily need to know what a good ROI is or even a good sell-through rate, we’ll crunch the numbers for you and provide a clear answer. One that you can then use to make Data-Driven Decisions about your books and your business.
There is a little homework to be done before you can use the analytic tools. ScribeCount is not all-knowing, so you’ll need to teach it about your books and series a bit before the tools can do their thing. Using the tools in the BookShelf you’ll need to merge your books so the system knows which books are the same across all of your sales and advertising platforms, then you’ll need to create the series you want to see from those books, and lastly, number the books in their proper reading order. This can be done in a few minutes using the tools we provide.
Once those tasks are completed, the series you’ve created will appear as options in the Analytics dropdown. Like this:

From there generating a report is as simple as five easy clicks.
Just choose:
- The series you wish to see.
- The date-range you wish to see.
- The platforms you wish to see.
- The formats you wish to see.
- Whether you wish to see your data presented in Royalties or Units.
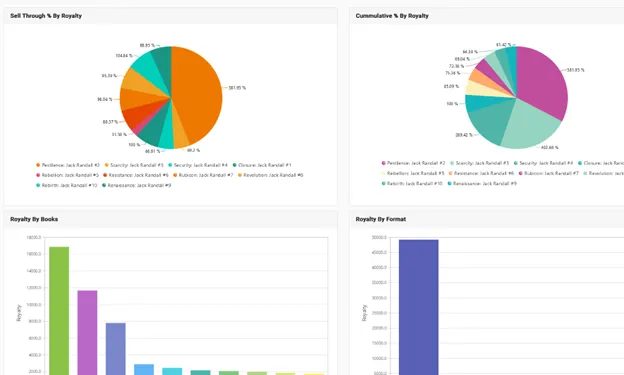
From there your report will be produced automatically. The data is expressed in several charts and a spreadsheet, which like all of our others is fully downloadable. Here’s a taste:
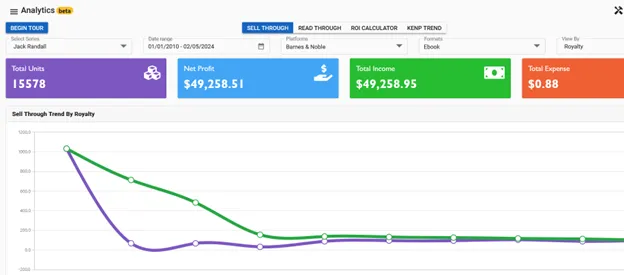
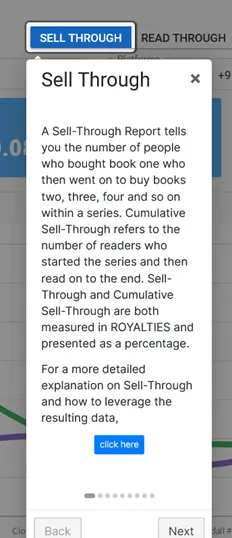
For those who are new to such reports and need a little help, we have included a walk-though tutorial application. Simply click on the BEGIN TOUR button in the upper left corner and each feature of the report will provide you with a text explanation of what it does and how to read it.
There are also links included to other resources for a more in-depth explanation. Those links will expand over the next few months to offer advice from a variety of vetted sources in both video and text formats.
Some tips:
- The more data you use in each report the better the results. Keep your date ranges as large as possible.
- Royalties or Units? No worries, the tools default to the correct one for each report. You do, however, have the ability to switch back and forth with a single click.
- Free-First-In-Series books are factored into the math, there’s no need to exclude them or adjust for their presence.
- Boxsets are NOT automatically factored in. This will be added in Phase Two. For now we recommend that you make separate series out of your boxsets and run reports with them only. If you DO wish to see them factored in we have a video explaining how on our YouTube
- KU and KOBO PLUS users can see Read-Through reports as well. The data is based on educated guesses derived from the limited information we get from Amazon and Kobo, but the end result is still accurate enough to make good decisions with.
- Royalty Split is also not factored in. This will arrive in Phase Two.
- What if I need KU data from months or years ago? No worries, we have that data archived and present it in the KENP TRENDS feature at the top of the page. You can get the KENP Rate and Global fund data there going back several years.
As mentioned, this is Phase One of the Analytics Package. We have several more tools on the production list but since these five are the basics that everyone asked for we are rolling them out now.
Phase Two will have the following:
- Royalty Split
- Ad Flagging (You enter the ad into the schedular and it appears as a vertical line in your charts)
- Compare Charts (Allows you to see two charts side-by-side or overlapped)
- Email and Newsletter data integration
- Production Data Integration (Word Count, Time in Seat, etc.)
- Website data integration (Visitor numbers, Clicks, Page-views, etc.)
With this data added to the package you’ll be able to answer even more questions. Such as:
- How much did I earn per hour last year?
- What is my Reader List Growth Rate?
- When will my new release earn out and make me a profit?
- How many website visits can be credited to that last advertisement?
- How much do I make for every hour I spend writing?
The Analytics Package is the culmination of years of work building up all the other features of ScribeCount. Instead of just showing you data, we can now tell you what it means. Think of it as Tell-Don’t -Show, which every author understands.
Bonus Announcements
Email Tracker
Author.Email will soon be joined by MailerLite, MailChimp, and Klavio. This will occur over the coming weeks. All this is in preparation for incorporating that data into your reports and from there making it available for breakdown through the Analytics tools in Phase Two.
Future Platforms
ScribeCount is currently in touch or working with BookVault, REAM, and Lulu to get them added to the ScribeCount dashboard. We’re unable to predict a push date at this time, but we’ll update everyone as soon as we can.
Extension Update
This is big. Starting in February fully half of the ScribeCount production team will be dedicated to updating the extension. This is required by both Microsoft/Azure and Google/Chrome and must be finished no later than June. What this will do is augment both the syncing and data-pull features at each platform. This will lead to faster and more reliable syncing and less glitches related to both. While this update is taking place we’ll be performing several upgrades to the various pages and features to make them more robust and user-friendly.
That concludes our introduction to the Analytics Package. I hope it becomes a valuable source of information for all ScribeCount users and allows you to make data-driven decisions that help your business grow. You can find it in the sidebar behind this:

Until next time,
Randall and the ScribeCount team